Advertisement
A robust Python package called GeoPandas facilitates easier analysis of geographic data. It helps new users handle maps, shapes, and boundaries with ease. Many find boundary extraction challenging, yet GeoPandas simplifies the process. It efficiently handles spatial data by combining the capabilities of Shapely and Pandas. You can load shapefiles, extract borders, and view the results with simple commands. This tutorial walks through the process of using GeoPandas to extract boundaries step-by-step.
Clear explanations make it easy for beginners to follow along. This guide also covers the installation of GeoPandas, importing data, and efficiently extracting boundaries. By the end, you'll confidently work with geographic boundaries in Python. Now, let's examine how to use GeoPandas for extracting simple map boundaries.
Shapely and Pandas are the foundations of GeoPandas, which handles both tabular and geometric data. It offers tools for creating maps, reading shapefiles, and doing spatial joins. Geographic data is complex; GeoPandas makes it easier to manage. The first step is to install GeoPandas on your system using pip or conda. Once installed, a single Python line can be used to import the library.
GeoDataFrames, which integrate rows, columns, and geometries, are introduced by GeoPandas. Shapes such as polygons, points, or lines can be stored in each record. In shapefiles and GeoJSON files, boundaries are usually represented as polygons. Before beginning any extraction, it is crucial to comprehend these formats. Verify that the geometries in your dataset are valid and accurate. When working with boundaries, it is helpful to verify the geometry type to prevent confusion and ensure accuracy.

Begin by identifying reliable data sources, such as OpenStreetMap or Natural Earth. These offer GeoJSON files and shapefiles for both local and global maps. Save the files to a known folder location on your computer. Use the standard command `import geopandas as gpd` to import GeoPandas after opening Python. Next, use the `gpd.read_file()` function to load the file into a GeoDataFrame.
The information will appear as rows, with each shape's geometry described. Use the “head()” method to quickly preview the first rows of the dataset. Confirm that your dataset uses the correct coordinate system. Use the .crs attribute to check the projection format. If necessary, correct mismatches by reprojecting using `.to_crs()`. Proper preparation ensures smooth boundary extraction later on.
GeoPandas provides basic geometry attributes for extracting map boundaries. The `.boundary` attribute is the most practical approach. When you apply it, boundary lines are produced for every polygon shape in your dataset. The extracted boundaries can then be saved as a new GeoDataFrame. It enables you to preserve boundary lines and original shapes independently. Use .plot() to visualize the lines on a map.
Check results carefully, as new users often confuse boundaries with centroids. Boundaries are the edges surrounding polygons, whereas centroids are the central points. Boundaries can be readily exported to new shapefiles or GeoJSON formats. For shapefiles, use `.to_file()`; for geojson outputs, use `.to_json()`. Results can be saved for use in subsequent mapping projects. Effective mastery of these commands for frequent use is facilitated by practice.
Visualizing extracted boundaries helps confirm their accuracy. GeoPandas offers a straightforward `.plot()` method for rapidly displaying results. Call .plot() on your boundary GeoDataFrame to see edges clearly. For clarity, you can alter the figure size, line colors, and thickness. For greater control over styling, consider using Matplotlib in conjunction with GeoPandas for larger datasets. Include titles, labels, and legends to make the map more educational.
Compare the boundary layer with the original map to confirm precision. Plotting the two layers together in various colors will overlay them. That makes it easier to verify that the extracted boundaries match the original polygons. Matplotlib's `savefig()` function allows you to save the visualization as an image. Maintaining visual outputs makes it simple to embed in reports or share with colleagues. Visualization adds an interactive element that helps beginners learn effectively.
When extracting boundaries with GeoPandas, new users often encounter errors. One frequent issue is the presence of invalid geometries in datasets. When using geometry attributes, these may result in failures. Such issues can be resolved by cleaning shapes with `.buffer(0)`. Another challenge is mismatched coordinate reference systems between datasets. Reproject with .to_crs() to maintain consistent units before combining maps. On simple computers, large datasets may cause memory errors or load slowly.
Before scaling up to full data, think about working with smaller subsets. Overlapping boundaries may make the visualization look unclear or incomplete. Adjust transparency settings to make plot layers more visible. Saving boundaries to shapefiles may also result in export errors. Verify that filenames and extensions adhere precisely to the necessary formats. Gaining confidence when using GeoPandas is facilitated by being aware of these problems.

There are numerous practical uses for GeoPandas boundary extraction. Urban planners use boundaries to divide areas for housing and construction. Environmental researchers do effective mapping of conservation areas, water bodies, and forest boundaries. Governments use boundary maps for district planning, elections, and censuses. Companies use extracted borders to analyze service coverage or delivery zones.
Scholars use boundary layers to research geography and changes in land use. For tasks involving predictive mapping, GeoPandas facilitates integration with machine learning. For insights, you can combine population or climate statistics with boundary data to gain a deeper understanding. Clear and uncomplicated visualization layers can also be created with the aid of extracted boundaries. Interactive dashboards, reports, and presentations can all benefit from these. Practical examples show why new users should develop these skills early in their learning. The ability to extract boundaries is utilized in various fields and industries.
GeoPandas makes boundary extraction clear and accessible for beginners. You gained an understanding of the fundamentals of data loading, boundary extraction, and output visualization. The process involves setting up GeoPandas, checking datasets, and applying geometry attributes. Cleaning techniques and projection adjustments can be used to correct common errors. Planning, research, and business analysis are just a few of the practical uses for extracted boundaries. Consistent practice helps anyone gain proficiency in boundary extraction with GeoPandas. Investigate increasingly challenging mapping projects as your confidence increases. GeoPandas enables you to work efficiently with boundaries and maps.
Advertisement

Which data science companies are actually making a difference in 2025? These nine firms are reshaping how businesses use data—making it faster, smarter, and more useful

Explore the role of a Director of Machine Learning in the financial sector. Learn how machine learning is transforming risk, compliance, and decision-making in finance
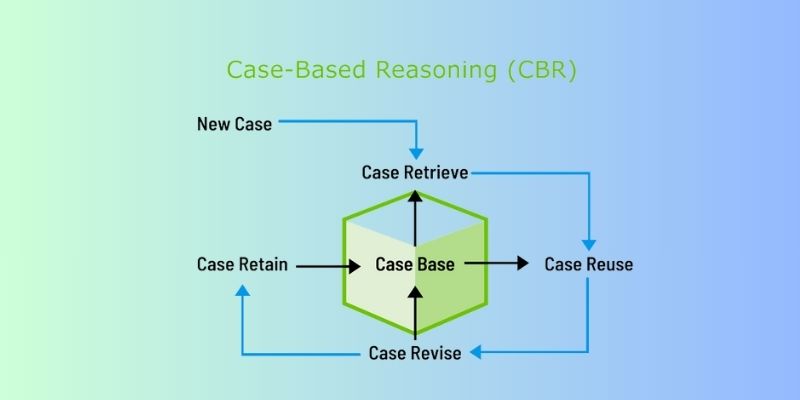
Discover how Case-Based Reasoning (CBR) helps AI systems solve problems by learning from past cases. A beginner-friendly guide

How to Integrate AI in a Physical Environment through a clear, step-by-step process. This guide explains how to connect data, sensors, and software to create intelligent spaces that adapt, learn, and improve over time

Looking for faster, more reliable builds? Accelerate 1.0.0 uses caching to cut compile times and keep outputs consistent across environments

Explore how multimodal GenAI is reshaping industries by boosting creativity, speed, and smarter human-machine interaction

SmolVLM2 brings efficient video understanding to every device by combining lightweight architecture with strong multimodal capabilities. Discover how this compact model runs real-time video tasks on mobile and edge systems
Llama 3.2 brings local performance and vision support to your device. Faster responses, offline access, and image understanding—all without relying on the cloud

Explore the top 11 generative AI startups making waves in 2025. From language models and code assistants to 3D tools and brand-safe content, these companies are changing how we create

Microsoft’s in-house Maia 100 and Cobalt CPU mark a strategic shift in AI and cloud infrastructure. Learn how these custom chips power Azure services with better performance and control

Learn key differences between RPA and BPM to enhance workflow automation strategy and boost enterprise process efficiency

Why is Alibaba focusing on generative AI over quantum computing? From real-world applications to faster returns, here are eight reasons shaping their strategy today